Click on the plot to rain on the landscape!
What is this image showing?
The image above depicts a digital elevation model (DEM). Each pixel in the DEM represents the height of the landscape, where dark areas are low and light areas are high.
 How does it work?
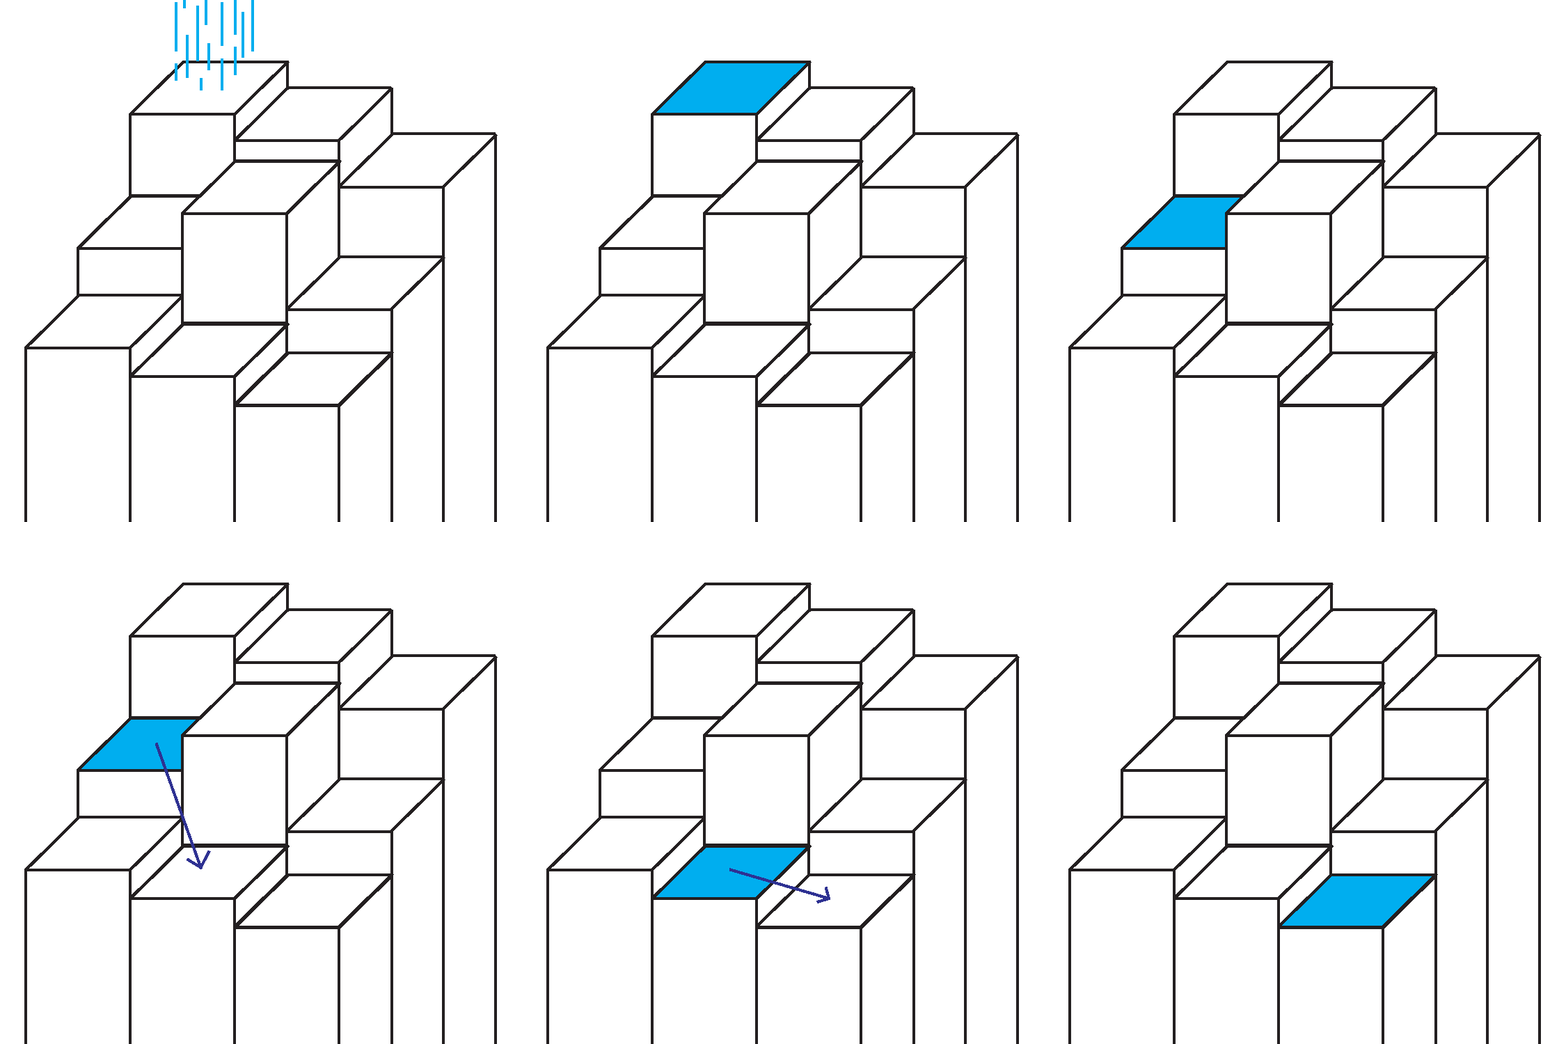
Here, we zoom in on 9 of the pixels of the DEM. When rain lands on a pixel, we tell the water to move in the direction of steepest descent. Think about placing a ball on a hill. Which way does the ball tend to roll?
More interactive models to come...
I'm still learning Javascript, but I hope to make more web-based interactive models in the future. If you want to make your own models, you can find my source code here.
